


CONNECTIONS
Terna manages the connection of electricity plants to the Italian national transmission grid and is obliged to carry out a grid connection for all parties that make such a request. In particular, Terna is responsible for the high and extra-high-voltage connection of plants with a power of 10 MW or higher. The connection request is the first step in a process that ends with the construction of the plant and connection to the grid.

 to show the More options label
 to show the Focus mode label

 to set the date range using the calendar.
CONNECTIONS
Terna manages the connection of electricity plants to the Italian national transmission grid and is obliged to carry out a grid connection for all parties that make such a request. In particular, Terna is responsible for the high and extra-high-voltage connection of plants with a power of 10 MW or higher. The connection request is the first step in a process that ends with the construction of the plant and connection to the grid.
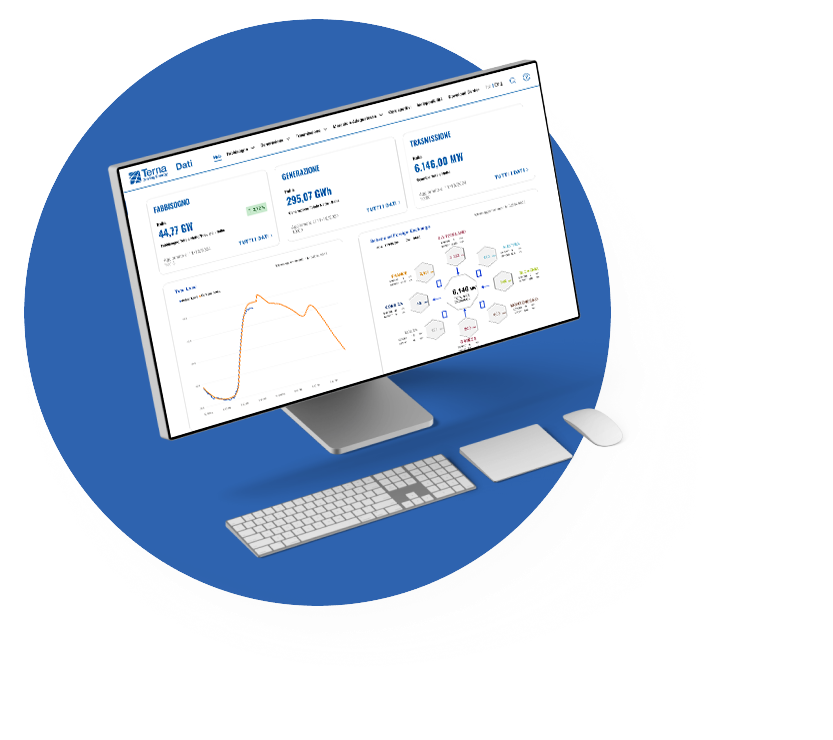
Decarbonisation targets pose new challenges for the electricity sector. Under the National Integrated Energy and Climate Plan (PNIEC), it will be necessary to install approximately 65 GW of new renewable capacity in Italy by 2030 (beyond that already installed as at 31 December 2023), to cover a share of demand equal to 110-115 TWh with energy generated by clean sources. In this context, monitoring requests for the connection of renewable plants and storage systems to the grid is essential in order to identify trends and areas with a greater concentration of plants, and to then plan the development of infrastructure and all the tools required to achieve the targets. This has prompted the creation of Terna’s first digital dashboard for requests for the connection of plants to the Italian national transmission grid. This important and innovative information tool benefits operators in the sector, with which Terna shares information on the regional and local distribution and authorisation status of connection requests for renewables, broken down by source (solar power, onshore wind power, offshore wind power, hydroelectric, geothermal and biomass), for storage systems (pure pumping, mixed pumping, stand-alone storage, storage integrated with solar plants, storage integrated with wind power plants) and for consumer users (data center, cold ironing, other users).
Info on data
The graphic shows the total number, application status, and power (expressed in GW) of requests for the connection of storage systems to the grid, broken down into: pure pumping, mixed pumping, stand-alone storage, storage integrated with solar plants, and storage integrated with wind power plants. Using the interactive map, the data can be navigated at the regional, provincial, or municipal level.
The dashboard is updated on a monthly basis. Numerical data are always presented in English format (N.B. the full stop is used to separate decimals).
The content displayed is published by Terna solely for statistical and information purposes and disclosed in compliance with the rules of the Grid Code and applicable laws and regulations. Terna is not responsible for the accuracy of the data provided, which has been processed using information obtained from users during the procedure for connection to the national transmission grid. Terna cannot be held in any way responsible for any errors or omissions or for any damage of any type caused directly or indirectly by access to the website, inability or impossibility of access, observance of the indications contained, or their adoption. Terna shall update information on the website wherever possible, but cannot guarantee the completeness or accuracy of information, reserving the right to modify content at any time and without notice. Content on this website must not be used for purposes other than those permitted by applicable laws and regulations.